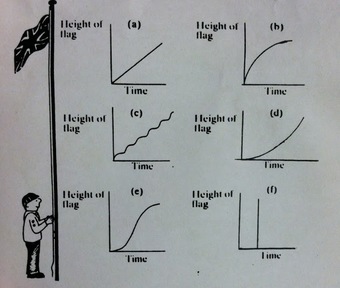
On the image above is giving different graphs that represent the height of the flag the youngest boy scout has to hoist up, and the time that it would take him. Graph A is demonstrating a steady time pulling the flag up, and showing constancy in putting it up, Graph B is showing that the time it takes to put up the flag are faster, but maybe wind was a variable that was being dealt with effecting it to slightly curve. Graph C is showing a break in the pulling of the flag and it being repeated over again. Graph D is showing that it took longer to get the flag up to its full height, Graph E is showing maybe a constant pull of the rope then a break to get it the rest of the way hoisted in the air. Graph F is showing that in one shot the flag was hoisted up in little time. The graph that is the most realistic in this situation is flag C, because when pulling up a flag there is a tug, a break, and then another tug on the rope and that is demonstrated in graph C. The least realistic for this situation is graph F, because only superman can pull a flag all the way to the top in one try, and it took very little time.
 RSS Feed
