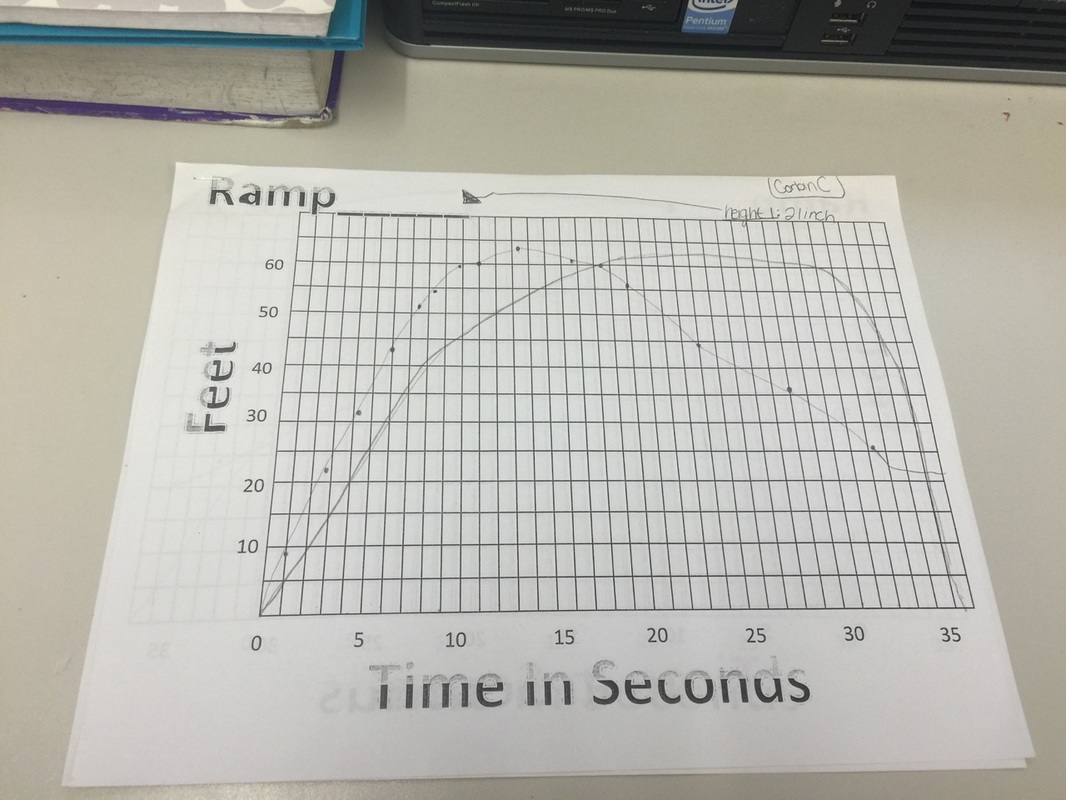
Skateboard ramp: 21 inches
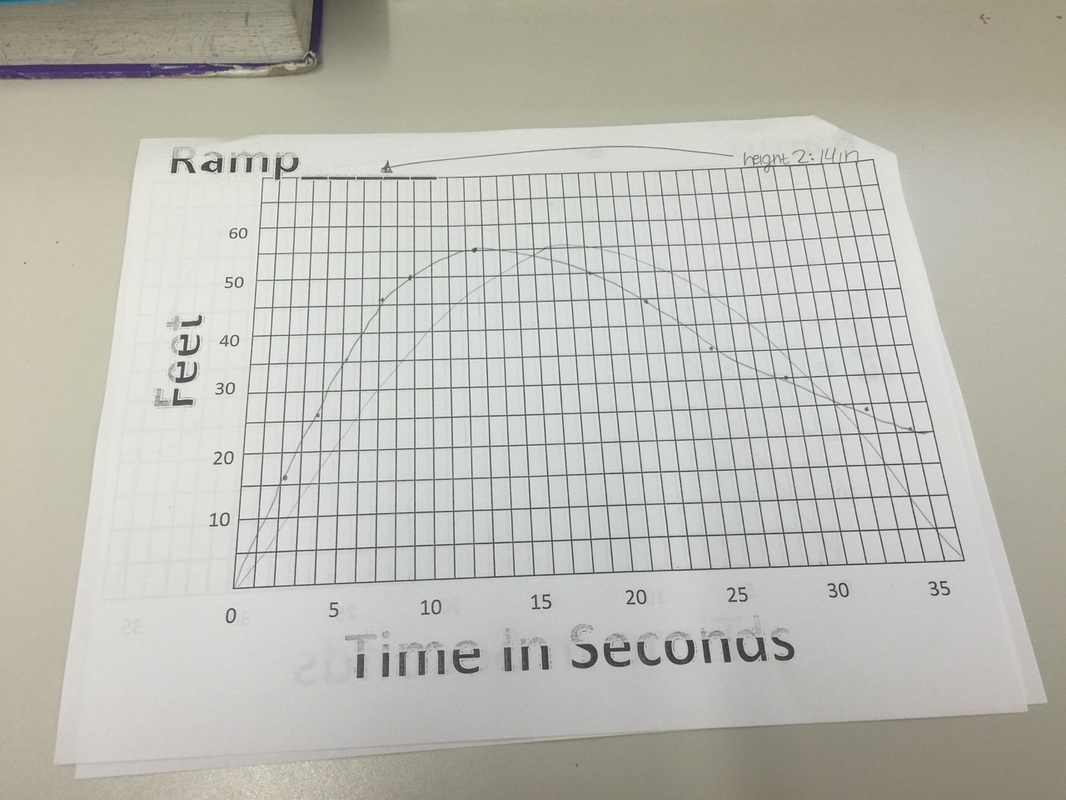
Skateboard ramp: 14 inches
skateboard ramp: 7 inches
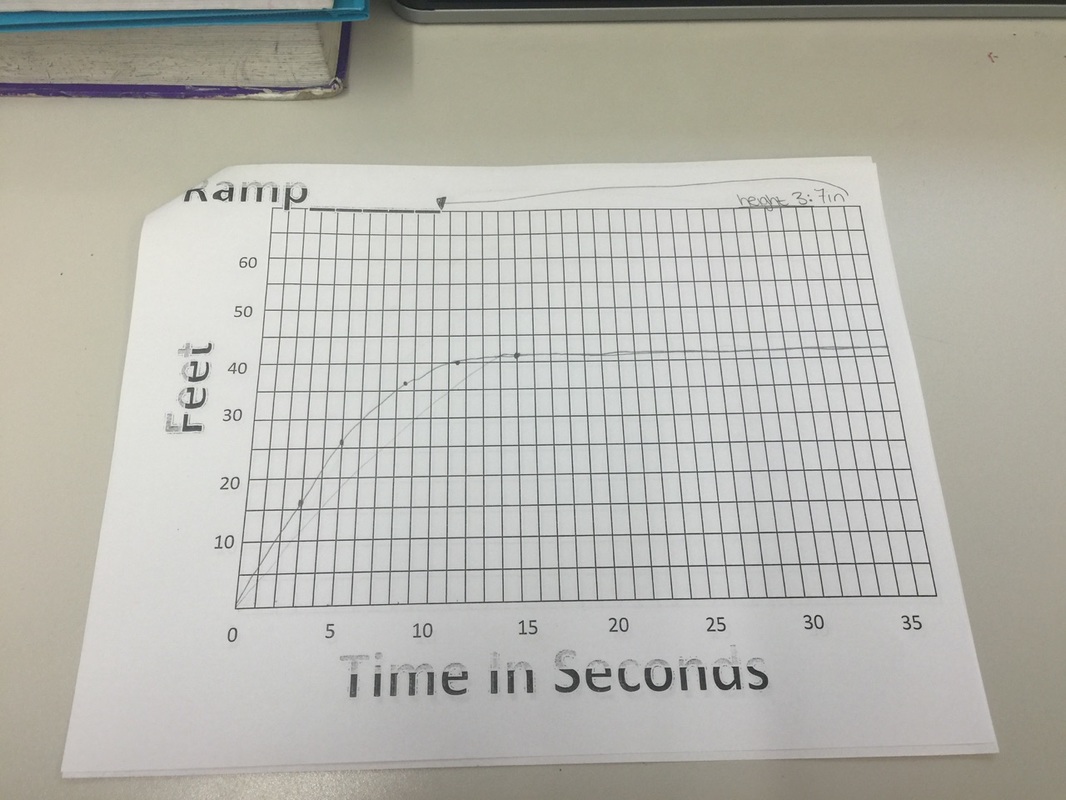
For the 21 inch ramp my prediction was way off from the actual graph the skate board made, for the 14 inch ramp my prediction got a little closer than my first prediction, but was off. The 7 inch prediction was pretty much the same as the actual graph, just slightly off at the beginning. The two graphs that were different are not as precise as the last, because the first graph(21 inch) I didn't really know how it was going to pan out, and it was a starter graph. The 14 inch graph was off because I learned that it tapered off at the end, and didn't just go back down to zero, and that's were I put my two mistakes and got on the dot pretty much for the 7 inch graph. My reasoning for the original graphs was made by the video, and watching the videos once and making the prediction graph, then watching the video in slow motion and graphing points and making the real graph. The zeros on the graph represent when the skateboard stopped, and no longer was moving. The graph rises the fastest when the skate board is going down the ramp, and has all that momentum, and it means that the graph took little time to peak, and more time to descend. When the graph falls the fastest it represents when the skate board is going in reverse back down the drive way, and it means it takes little time, but is slower then when it went down the ramp.
 RSS Feed
