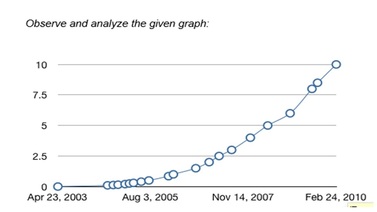
The graph above represents a function that is a exponential growth function.
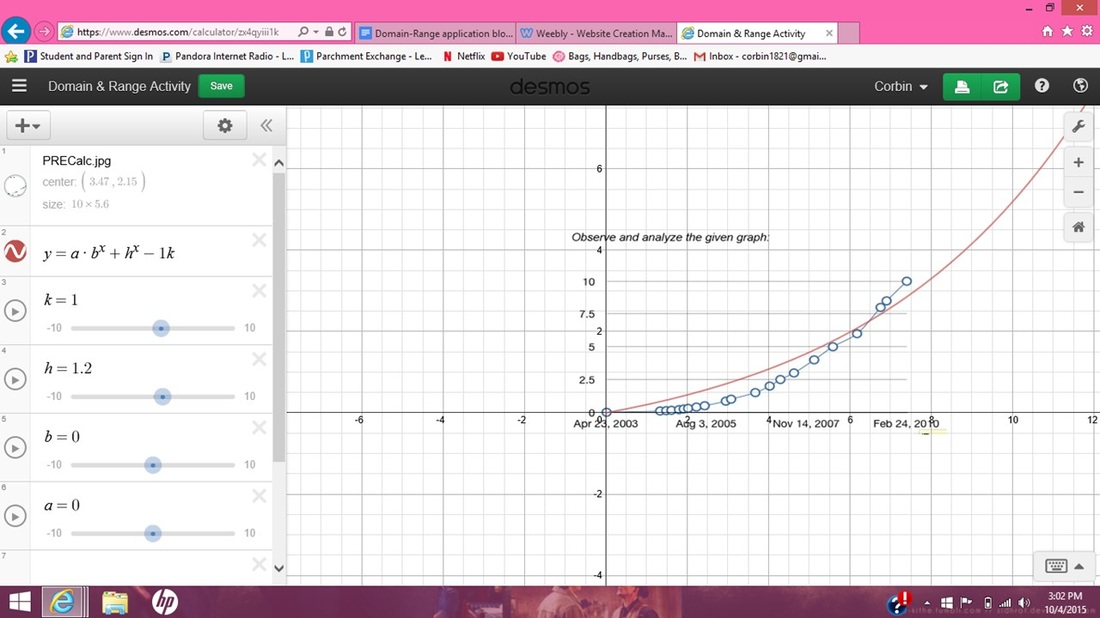
In the picture above I put a picture of the original graph into desmos calculator, and came up with a equation that represented the one that the original graphs direction was going in. I came up with the function y=a\cdot b^x+h^x-1k that is a little off, but shows the direction of the original graph pretty well. The domain of this function is [0, Infinity), The range of this function is any number greater than zero. http://www.billboard.com/biz/articles/news/digital-and-mobile/5855162/digital-music-sales-decrease-for-first-time-in-2013: This following link changes the prediction of the domain and range of this graph because music sales decreased in 2013, that means the graph is going to decrease as well, affecting the domain and range of this graph. Yes there is a problem with trying to extend a set of data points of a continuous graph because when changing the graph it means the graph will change, and it can be dramatically, or barley at all, it just depends on how much you change/extend the data points.
 RSS Feed
